Side by side
One frustration when reading academic papers and alike is the difficulty of assessing figures and tables at the same time as reading their description in the paper. The worst manifestation of this is journals that send papers for review with the tables and figures right at the end of the document! But even reading published work often involves flipping back and forth. The best thing about Twitter is finding out about new stuff. A post about parallaxr crossed my time line. Intrigued about what a parallax scroll document was, I took a look. It occurred to me it was possibly an interesting way to view figures and text simultaneously while still moving through a document or paper.
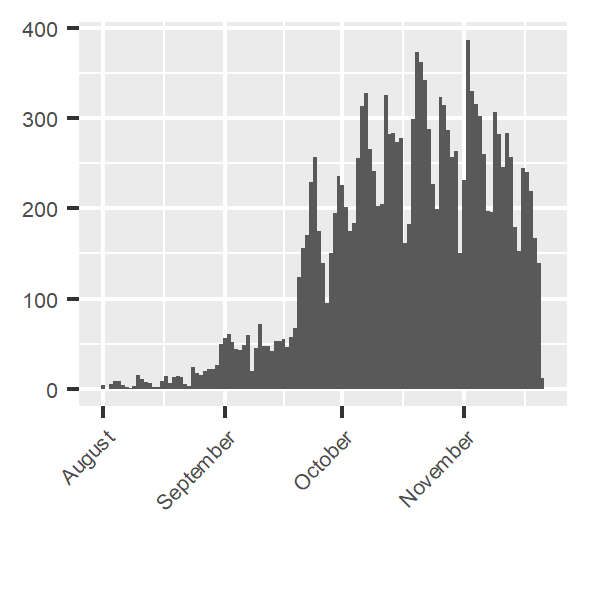
On left is covid 19 cases in Glasgow since August. The trend shows a relatively rapid rise until a recent decline. Now as you scroll down the picture will change